Operations in 2017
Net sales
Adjusted EBITA margin1)
Organic sales
Adjusted return on capital employed1)
Adjusted EBITA1)
1) Excluding items affecting comparability.
Net sales increased 1.0% to SEK 42,014m (41,560). Organic sales, which exclude exchange rate effects, acquisitions and divestments, increased 0.5%, of which volume accounted for 0.7% and price/mix for –0.2%. Organic sales decreased 3.4% in mature markets. The decline was mainly related to lower prices and volumes of products sold as retailers’ brand. In emerging markets, which accounted for 44% of net sales, organic sales increased by 6.2%. The increase was related to Asia, Latin America and Russia. Exchange rate effects increased net sales by 0.5%.
Adjusted operating profit before amortization of acquisition-related intangible assets (EBITA)1) declined 8% (9% excluding currency translation effects) to SEK 4,084m (4,450). This decrease was mainly related to higher raw material costs that had a negative impact of SEK 1,000m on earnings. Lower prices also had a negative impact on earnings. Higher volumes and cost savings positively impacted earnings.
Adjusted EBITA margin1) was 9.7% (10.7).
Adjusted return on capital employed1) was 9.8% (10.9%).
Operating cash surplus amounted to SEK 6,163m (6,455).
Operating cash flow amounted to SEK 3,850m (5,199).
Capital expenditures amounted to SEK 2,889m (2,646).
1) Excluding items affecting comparability.
SEKm |
2017 |
2016 |
||
|
||||
Net sales |
42,014 |
41,560 |
||
Operating cash surplus |
6,163 |
6,455 |
||
Change in working capital |
–425 |
891 |
||
Current capital expenditures, net |
–1,749 |
–1,892 |
||
Other operating cash flow |
–139 |
–255 |
||
Operating cash flow |
3,850 |
5,199 |
||
Adjusted EBITA1) |
4,084 |
4,450 |
||
Adjusted EBITA margin1), % |
9.7 |
10.7 |
||
Capital employed |
43,569 |
40,082 |
||
Adjusted return on capital employed1), % |
9.8 |
10.9 |
||
Strategic capital expenditures |
|
|
||
plant and equipment |
–1,140 |
–754 |
||
company acquisitions/divestments |
25 |
0 |
||
Average number of employees |
21,397 |
20,880 |
||
No. of employees at Dec. 31 |
21,563 |
21,371 |
||
Emerging markets accounted for
of the business area’s net sales in 2017. In emerging markets, organic sales increased by 6.2% for 2017.
Net sales and adjusted EBITA margin1)
1) Excluding items affecting comparability.
Adjusted EBITA1) and adjusted return on capital employed1)
1) Excluding items affecting comparability.

Net sales by region
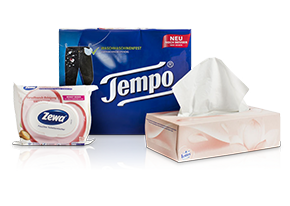
For Consumer Tissue, 34% of total sales were related to retailers’ brands.