Professional Hygiene

The Tork PeakServe family is growing and is now available as standard and mini dispensers and as adapters for recessed towel cabinets. This enables customers to increase efficiency by using the same paper hand towel refill across the entire facility.
Offering
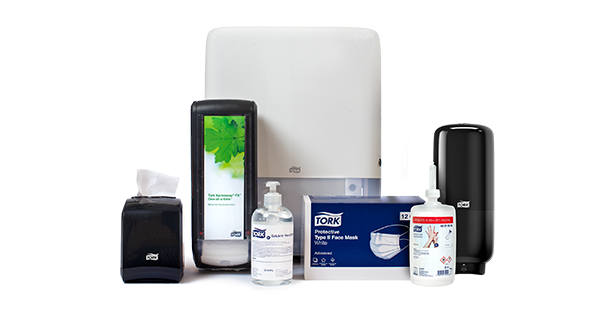
Essity’s offering comprises complete hygiene solutions, including toilet paper, paper hand towels, napkins, hand soap, hand lotion, hand sanitizers, dispensers, cleaning and wiping products, face masks, and service and maintenance. Essity also offers digital solutions, such as Internet of Things sensor technology that enables data-driven cleaning.
Customers consist of companies and office buildings, universities, healthcare facilities, industries, restaurants, hotels, stadiums and other public venues. Distribution channels for the products consist of distributors and e-commerce.
Market positions
Essity is the world’s largest supplier of products and services in the market for professional hygiene with the globally leading Tork brand. We are the market leader in Europe and hold a market share that is more than twice the size of the second largest player. Essity is the second largest supplier in North America and holds a particularly strong market position in the food service segment, where we estimate that the company supplies approximately every second napkin. Essity also has strong positions in emerging markets, such as Russia and Colombia, where we are the market leader. Essity is number three in the market in Asia through its majority shareholding in Vinda.
Production facilities
At the end of 2020, Professional Hygiene had production at 43 sites in 20 countries.
Operations in 2020
Net sales declined 17.3% to SEK 25,418m (30,731). Organic net sales, which exclude exchange rate effects, acquisitions and divestments, declined 14.6%. Sales were negatively impacted by the COVID-19 pandemic and the related lockdowns and restrictions. This has mainly had a negative impact on demand in the customer segments of hotel, restaurant, catering, commercial buildings as well as schools and universities. Meanwhile, sales of dispensers have increased as a result of a greater focus on hygiene, with many customers replacing air dryers in favor of offering a more hygienic alternative. Furthermore, sales increased for wiping and cleaning products, as well as soap and hand sanitizer. Volumes declined by 16.7%. The price/mix increased 2.1% as a result of higher prices and a better mix. Organic net sales declined 14.8% in mature markets. In emerging markets, which accounted for 20% of net sales, organic net sales declined by 13.8%. Exchange rate effects reduced net sales by 2.7%.
The adjusted gross margin increased 0.1 of a percentage point to 26.9% (26.8). The gross margin was positively impacted by higher prices, a better mix, lower raw material costs and cost savings. Lower volumes and higher distribution costs had a negative impact on the margin. The adjusted EBITA margin decreased 1.5 percentage points to 13.0% (14.5). Sales and marketing costs increased as a share of net sales.
Adjusted EBITA decreased 26% (23% excluding currency translation effects, acquisitions and divestments) to SEK 3,317m (4,463).
Essity is the leading global player in professional hygiene

Brands

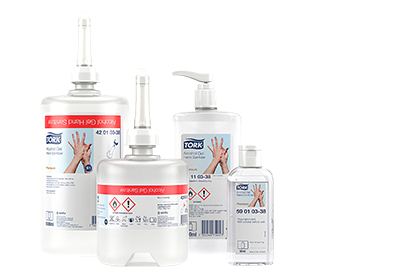
Essity and our Tork brand have worked for many years to raise awareness of the importance of good hand hygiene to avoid the spread of disease using products such as paper hand towels, soap and hand sanitizer. During the COVID-19 pandemic, Essity has worked to ensure a better global hygiene and health standard by safeguarding production and deliveries and continuing to develop customer offerings. For example, we increased delivery capacity of hand sanitizer and launched several new hand sanitizer products to meet the increase in demand.
Key figures
Net sales
Organic net sales1)
Adjusted gross margin2)
Adjusted EBITA2)
Adjusted EBITA margin2)
Adjusted return on
capital employed2)
Emerging markets’ share of business area’s net sales
Organic net sales1)
in emerging markets
Net sales
Earnings trend
Net sales by region
SEKm |
2020 |
2019 |
% |
|||||||||
|---|---|---|---|---|---|---|---|---|---|---|---|---|
Net sales |
25,418 |
30,731 |
–17 |
|||||||||
Organic net sales1), % |
–14.6 |
+3.6 |
|
|||||||||
Adjusted gross margin2), % |
26.9 |
26.8 |
|
|||||||||
Adjusted EBITA2) |
3,317 |
4,463 |
–26 |
|||||||||
Adjusted EBITA margin2), % |
13.0 |
14.5 |
|
|||||||||
Adjusted return on capital employed2), % |
14.6 |
18.9 |
|
|||||||||
Operating cash flow |
3,183 |
4,938 |
–36 |
|||||||||
Investments in non-current assets |
–1,135 |
–1,402 |
–19 |
|||||||||
Average number of employees |
6,909 |
7,287 |
–5 |
|||||||||
|
||||||||||||