The year at a glance
Key events
- Acquisition of BSN medical, a leading medical solutions company, was closed on April 3, 2017.
- On April 5, 2017, the Annual General Meeting of SCA decided, in accordance with the Board of Directors’ proposal, to distribute all shares in Essity Aktiebolag (publ) to SCA’s shareholders.
- On June 15, 2017, Essity Aktiebolag (publ) was listed on Nasdaq Stockholm.
- Financial targets for Essity Group were announced: Annual organic sales growth of above 3% and adjusted return on capital employed of above 15%.
- The hygiene business in India was discontinued.
- Decision was taken on restructuring measures in tissue production in the UK and US.
- Decision on investment in tissue operations in Mexico and the UK, and Baby Care operations in Europe.
- Collaboration with Microsoft on the Internet of Things to further strengthen Essity’s innovation agenda.
- Convening partner to the fifth annual meeting of the UN Foundation Dialogue on the Global Agenda held at the UN headquarters in New York. Discussions concerned how to achieve the 17 UN Sustainable Development Goals.
- CDP, an international not-for-profit charity that promotes a more sustainable economy, named Essity as global leader in initiatives for water and wood fiber-based materials and awarded the company its highest score.
- Recognized as one of the world’s top 100 most sustainable companies by Corporate Knights.
- Received honorary recognition at the European Paper Recycling Awards held by the European Parliament for its work on Tork PaperCircle™, the world’s first recycling service for paper hand towels.
Key figures
|
2017 |
|
2016 |
||||||||||||||||
|
SEK |
EUR4) |
|
SEK |
EUR4) |
||||||||||||||
|
|||||||||||||||||||
Net sales, SEKm/EURm |
109,265 |
11,343 |
|
101,238 |
10,706 |
||||||||||||||
EBITA, SEKm/EURm |
12,550 |
1,303 |
|
9,347 |
989 |
||||||||||||||
Adjusted EBITA1), SEKm/EURm |
13,405 |
1,392 |
|
11,992 |
1,268 |
||||||||||||||
EBITA margin, % |
11.5 |
|
|
9.2 |
|
||||||||||||||
Adjusted EBITA margin1), % |
12.3 |
|
|
11.8 |
|
||||||||||||||
Operating profit, SEKm/EURm |
11,905 |
1,236 |
|
9,008 |
953 |
||||||||||||||
Adjusted operating profit1), SEKm/EURm |
12,845 |
1,334 |
|
11,833 |
1,251 |
||||||||||||||
Operating margin, % |
10.9 |
|
|
8.9 |
|
||||||||||||||
Adjusted operating margin1), % |
11.8 |
|
|
11.7 |
|
||||||||||||||
Profit before tax, SEKm/EURm |
10,723 |
1,113 |
|
8,173 |
865 |
||||||||||||||
Adjusted profit before tax1), SEKm/EURm |
11,663 |
1,211 |
|
10,998 |
1,163 |
||||||||||||||
Profit for the year, SEKm/EURm |
8,785 |
912 |
|
4,242 |
449 |
||||||||||||||
Adjusted profit for the year1), SEKm/EURm |
9,472 |
983 |
|
6,643 |
703 |
||||||||||||||
Earnings per share, SEK |
11.56 |
|
|
5.412) |
|
||||||||||||||
Adjusted earnings per share3), SEK |
13.09 |
|
|
8.992) |
|
||||||||||||||
Cash flow from current operations per share, SEK |
12.45 |
|
|
12.192) |
|
||||||||||||||
Equity per share, SEK |
70.58 |
|
|
56.132) |
|
||||||||||||||
Dividend per share, SEK |
5.755) |
|
|
|
|
||||||||||||||
Strategic capital expenditures, including acquisitions, SEKm/EURm |
–28,146 |
–2,922 |
|
–8,573 |
–907 |
||||||||||||||
Divestments, SEKm/EURm |
29 |
3 |
|
369 |
39 |
||||||||||||||
Equity, SEKm/EURm |
49,570 |
5,039 |
|
39,580 |
4,141 |
||||||||||||||
Return on capital employed, % |
13.9 |
|
|
12.8 |
|
||||||||||||||
Adjusted return on capital employed1), % |
14.9 |
|
|
16.4 |
|
||||||||||||||
Return on equity, % |
19.8 |
|
|
9.3 |
|
||||||||||||||
Adjusted return on equity1), % |
21.3 |
|
|
14.5 |
|
||||||||||||||
Debt/equity ratio |
1.06 |
|
|
0.89 |
|
||||||||||||||
Debt/equity ratio, excluding pension liabilities |
0.99 |
|
|
0.76 |
|
||||||||||||||
Average number of employees |
46,385 |
|
|
42,149 |
|
||||||||||||||
No. of employees at Dec. 31 |
47,700 |
|
|
42,520 |
|
||||||||||||||
Accident frequency rate, (LTA6)/1,000,000 WH) |
3.8 |
|
|
4.1 |
|
||||||||||||||
People and nature innovations7), % |
42 |
|
|
41 |
|
||||||||||||||
Net sales and adjusted EBITA margin1)

1) Excluding items affecting comparability.
Adjusted EBITA1)

Cash flow from current operations

Accident frequency rate

2) Lost Time Accidents.
Net sales 2017 by region

Net sales 2017 by country, SEKm

Essity educated more than 2.5 million in hygiene and health
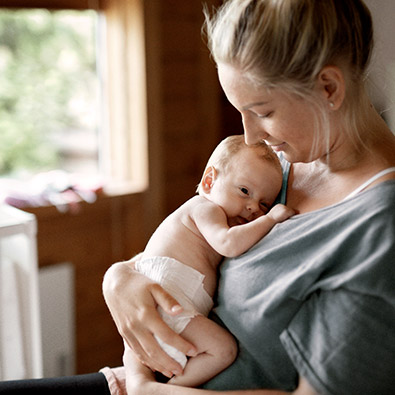
100,000 parents-to-be
More than 100,000 parents-to-be took part in courses on breastfeeding, nutrition and hygiene, and how childbirth affects women and women’s bodies.
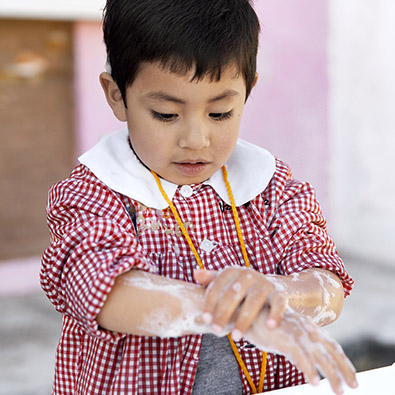
300,000 children
Almost 300,000 children and young people took part in courses about hand hygiene through initiatives in schools, and via the popular and educational app “Ella’s hand washing adventure”.

100,000 nurses
More than 100,000 nurses and other caregivers were trained in incontinence care, skincare, dementia, lymphology and wound care across the globe.